QuantLink AI · Analytics Product

One click from research notebook to live dashboard.

Notebook Dashboards turns a Python research notebook into a shareable, interactive product: typed inputs, scheduled reruns, live embeds, and server-side pivots and cross-filtering over every row of the data. I led the build, from the drag-and-drop editor down to the query engine.

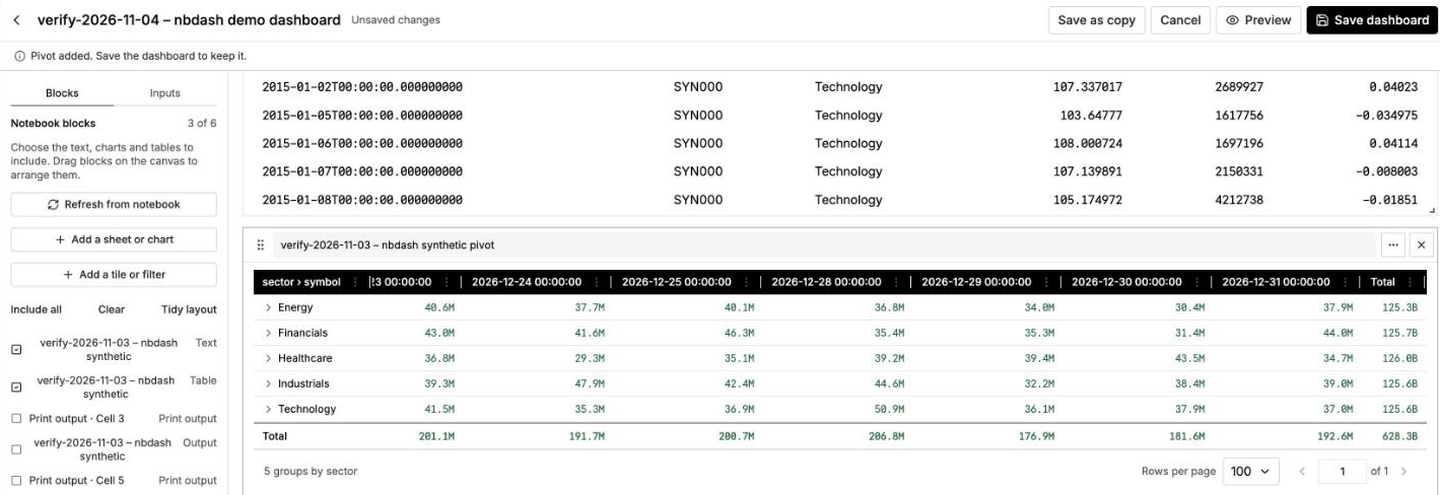
Notebook dashboard editor with a pivot tile showing sector rows, daily columns and server-computed totals
Pivot tile: sector subtotals and grand total computed server-side over every row of a synthetic price set.
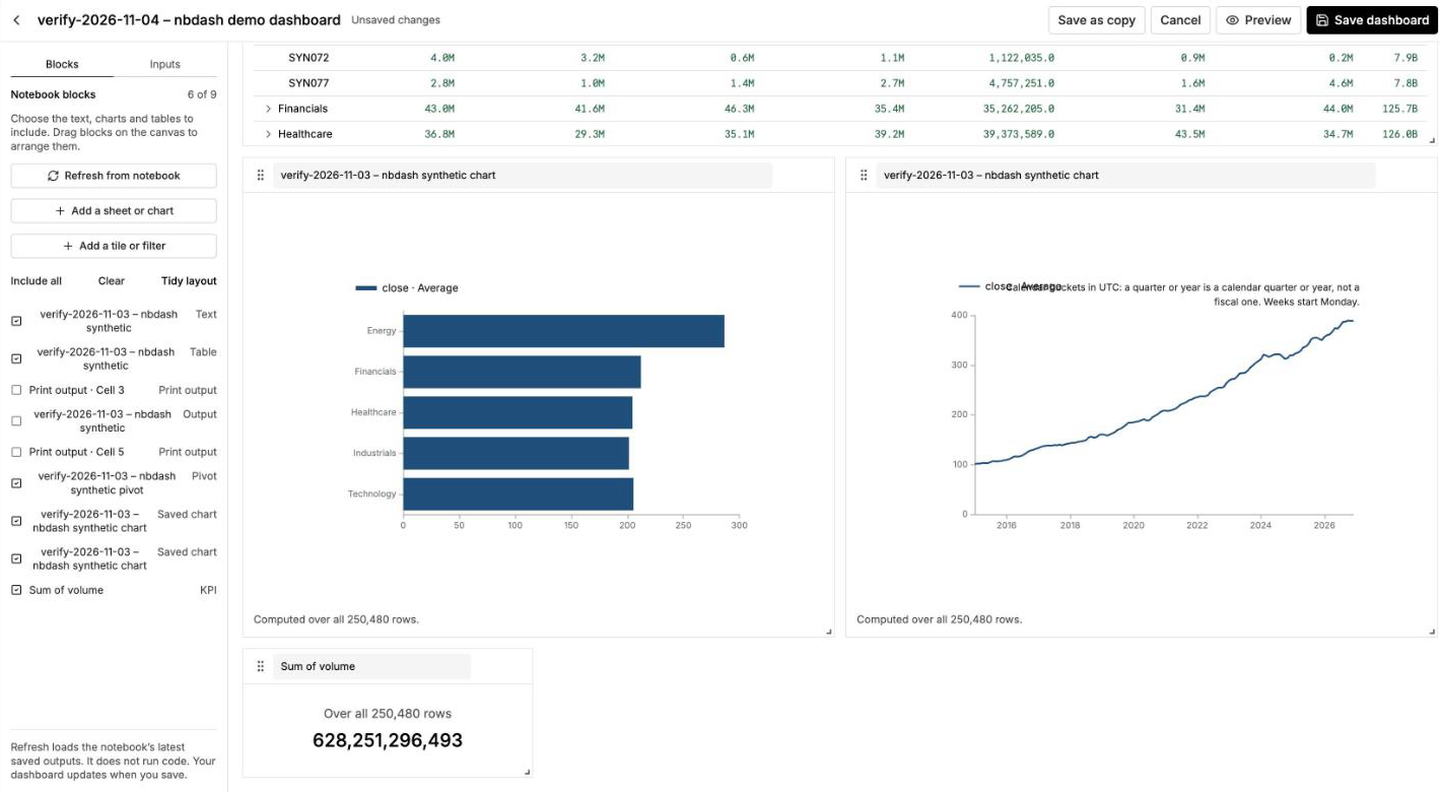
Dashboard editor with notebook blocks in a sidebar and bar chart, line chart and KPI tiles on a grid
Editor: notebook blocks on the left; authored bar, line and KPI tiles on the grid, each computed over the full dataset.

Research code becomes a product with no rewrite.

A competitive audit of 16 tools (Hex, marimo, Panel, Mercury, Quarto, Voilà and more) shaped the v2 design.

  • "Create dashboard" lifts a notebook's outputs onto a drag-and-resize grid, with no code changes.
  • Typed inputs are inferred from the notebook's own literals; each rerun executes in an isolated kernel and swaps fresh outputs into the existing tiles.
  • Scheduled reruns pause after repeated failures; Explore tiles add server-side pivots, chart-click cross-filtering and live embeds.
  • Sharing grants with owner-only runs: viewers read cached results, never execute code.

Every row counted, every limit named.

Large DataFrames are staged as Parquet (up to 50M rows) and served through Arrow streams, so paging, sorting, search and filters cover the full dataset, not a sample.

  • Third-party pivot engines were evaluated and rejected over licensing and security concerns and replaced by an in-house, spec-driven pivot and chart engine on DuckDB.
  • A worst-case query that compiled for 28 s, peaked at 10.8 GiB and built 615 MB of JSON in Python was re-engineered: streamed DuckDB-written answers, cancellable compilation, and deterministic float aggregation so paging stays stable.
  • One versioned limits spec generates Python, TypeScript and SQL for every consumer, hashed so all services agree; under a "highest limit that works" policy, every cap is measured, documented and refused by name, never silently truncated.
  • Heartbeats, stale-run detection, idempotent automatic retry (including runs interrupted by deploys), bounded worker permits, and compare-and-swap publication, so a run never overwrites a newer edit.

Checked against hand-computed answers.

Verification went beyond green builds: the system was audited against its own requirements and then stress-tested on a real research workload.

  • Requirements and review items audited against what actually shipped; every aggregation matched a hand-computed answer.
  • Capstone: a full seven-tab stock research page (overview, financials, options with gamma exposure and a 3D implied-volatility surface, DCF modeling, filings, holders, news) rebuilt as a dashboard.
  • The rebuild exercised the platform end to end, from the UI down to SEC XBRL financial-statement derivations: fiscal quarters on 53-week years, TTM, EBITDA, and de-cumulated year-to-date figures.